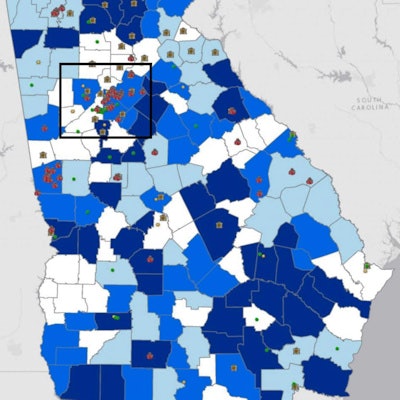
A March 11 graphic published by the U.S. Centers for Disease Control and Prevention (CDC) visualizes how well dental safety programs meet the needs of children in Georgia. Similar graphics could be made for other states to help decision-makers better identify gaps in resources.
The research team published the graphic as part of a report in the March edition of Preventing Chronic Disease: Public Health Research, Practice, and Policy, a CDC publication. It uses publicly available data to chart each county by high or low levels of untreated tooth decay (UTD) in children ages 6 to 9 and the severity of the dental workforce shortage (Dshort).
The researchers then overlaid available dental safety-net locations in Georgia with the map of unmet children's dental needs. The result is a graphic that visualizes how well resources are being allocated.


Image courtesy of the CDC. Hamilton EK, Bernal J, Lin M, Thornton-Evans G, Griffin SO. Visualizing county-level data to target dental safety-net programs for children. Prev Chronic Dis. 2021;18:200488. doi:10.5888/pcd18.200488.
"Our visualization indicated good allocation of scarce dental public health resources," wrote the group, led by Erin Hamilton, PhD, from CyberData Technologies in Herndon, VA.
Among the 159 counties in Georgia, more than two-thirds of dental safety-net programs were in high-need counties -- more than twice the number in low-need counties. However, with scarce resources, many high-need counties had no dental safety program, and programs were more clustered in areas close to Atlanta.
"The maps also illustrate the importance of a granular visualization in areas with diverse populations, such as metropolitan areas," the authors wrote. "If only county levels are used, small pockets of need may be missed, as in Fulton County."
The map provides decision-makers with a tool to help assess the allocation of current safety-net programs, they noted. Additionally, maps could be created from public data for all U.S. states.
"The data used to generate these maps are publicly available for states nationwide and thus, these maps could be replicated throughout the United States," the authors concluded.